Can independent internet service providers (public or private) actually get 50-percent market share when competing against telcos and cable companies? Ting Internet believes so, but results from other firms suggest the level of competitor pricing really does matter. G
It always is difficult to quantify take rates for gigabit internet access services, as virtually no internet service provider ever releases such figures. That has been the case since faster internet access services, priced at a market premium, began appearing. The reason for the reporting reticence is that take rates for the fastest, most expensive tier of service tend to be minimal.
Still, ISPs do tout some figures. Mediacom, for example, claims that between 10 percent to 20 percent of its new accounts are buying gigabit services costing between $125 a month to $140 a month. Again, it is hard to quantify what that means.
The actual number or percentage of account that change providers every year (churn) in the fixed network internet access business arguably varies between markets with strong offers (where fiber to home is sold, and where gigabit cable services also are sold).
Churn arguably is highest where a cable operator offering speeds in the hundreds of megabits per second competes with a telco only able to sell slower digital subscriber line service. AT&T and Verizon, for example, tend to see low churn rates, where other independent telcos with less fiber to home tend to see higher churn rates.
Much obviously depends on pricing levels. In markets where a gigabit ISP sells 1,000-Mbps service at prices that match the current or legacy prices for slower service (perhaps 100 Mbps), take rates can climb dramattically.
What is harder to model are markets where a clear price premium exists. It will matter when a reasonably-fast standard offer costs $50 a month and the gigabit offer costs more than $125 a month.
Presumably, in such market, demand will be anchored by business demand, higher-income households and multi-user households.
Perhaps the most-optimistic provider to make public predications is Ting Internet, which tends to argue it will get adoption as high as 50 percent in any new market it launches, within five years or so. Initial take rates when first marketed appear to be about 20 percent.
In its fourth quarter 2017 report, Tucows reported Ting Internet take rates of 30 percent take rates in areas where it is able to market its gigabit service.
Ting prices its gigabit service at $90 a month. At that price, it is lower than Comcast and other cable companies charge, but higher than the $70 a month some other ISPs offer. The point is that Ting is pricing at a significant price premium to “standard” offers that offer less value (in terms of speed), but not pricing as high as cable companies or telco practice.
We are likely to see much more of this sort of independent ISP competition in the fixed market, not to mention 5G-based gigabit offers from mobile suppliers.
At least in principle, more than 100 Colorado communities could see some form of
municipal broadband network created, as voters in those communities have approved such moves.
Longmont, Colo. already has built out a portion of its planned gigabit internet access network, aided by that city’s ownership of a municipal power utility, meaning Longmont owns rights of way, distribution facilities, rolling stock and other assets helpful to creating a city-wide internet access network.
In Centennial, Colo., private internet service provider Ting Internet will piggyback on a new government network to be built by the city of Centennial itself.
Also, it sometimes is difficult to ascertain precisely what take rates are, since many independent ISPs challenging cable or telco suppliers seem to count “units sold” rather than “households served.”
That matters when an ISP sells two or more products, and then calculates adoption rates as “units sold divided by households passed.”
In other words, penetration is measured in terms of revenue-generating units, not “locations” or “households.” Each unit sold (voice, video or internet access) is counted against the base of locations. So a single location buying three services results counts as much as three other homes buying just one service.
Customer “penetration” by household therefore is different from penetration measured as a function of units sold. The difference is that determining the magnitude of stranded assets hinges on how many locations passed generate revenue.
Assume that, on average, a typical household buys 66 percent of the total suite of services (two of three triple play services or three of five services, for example).
The difference is significant. Measuring “penetration” by units sold, penetration appears to be as high as 76 percent to 87 percent. Measured as a function of homes generating revenue, penetration could be as low as nine percent, or as high as 44 percent, with a “typical” value being something between 20 percent to 25 percent of homes passed.
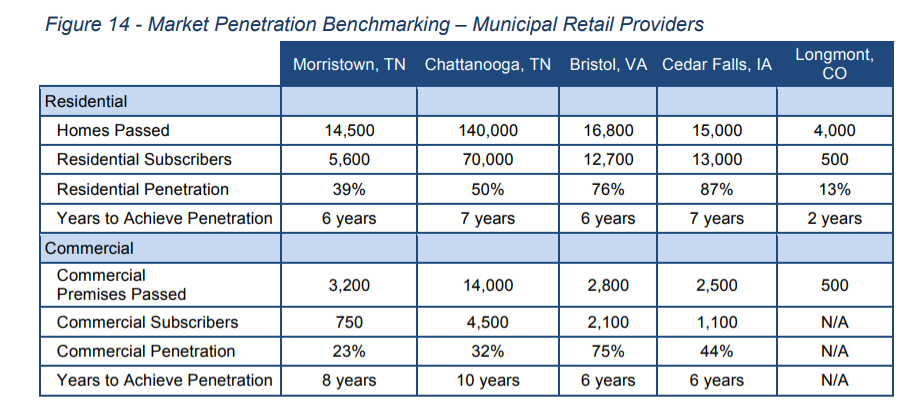
Penetration: Units Sold or Homes Buying Service?
| |||||
Morristown
|
Chattanooga
|
Bristol
|
Cedar Falls
|
Longmont
| |
homes passed
|
14500
|
140000
|
16800
|
15000
|
4000
|
subscribers
|
5600
|
70000
|
12700
|
13000
|
500
|
units sold
|
39%
|
50%
|
76%
|
87%
|
13%
|
services sold
|
3
|
3
|
5
|
3
|
2
|
HH buys .66 =
|
2
|
2
|
3
|
2
|
1
|
Homes served
|
2828
|
35354
|
3848
|
6566
|
379
|
penetration
|
20%
|
25%
|
23%
|
44%
|
9%
|
It might be worth pointing out that all these communities (Morristown, Chattanooga, Bristol, Cedar Falls and Longmont) have municipally-owned utility companies, and might therefore represent a sort of best case for retail operations serving consumers.
That seems consistent with other evidence. In markets where a telco and a cable operator are competent, as is the attacking ISP (municipal or private), market share might take a structure of 40-40-20 or so, possibly 50-30-20 in areas where the telco does not have the ability to invest in faster broadband and the cable operator has the largest share.
Beyond the actual cost of the network, and the business role chosen by the municipality, details of revenue generation (homes that generate revenue as a percentage of total; number of services offered) are fundamental.
Beyond that are the other operating and marketing costs, overhead and need for repaying borrowed funds and making interest payments, on the part of the retail service provider.
One might argue that most other communities, without the advantages ownership of an electric utility provides, will often find the lower risk of a shared public-private approach more appealing.
Also, some ISPs might find the availability of some amount of wholesale or shared infrastructure makes a meaningful difference in a business model.
One might suggest there are a couple of potential practical implications. Efforts by incumbent ISPs to raise retail prices in the same way that video entertainment prices have grown (far higher than the rate of overall inflation) will increase the odds new competitors enter a market.
Higher prices, in fact, will increase the likelihood of new entrants entering a market, as the higher prices increase the attractiveness of doing so.
In at least some cases, the new competitors will be firms such as Verizon, which now has announced it will essentially overbuild an AT&T and Comcast markets in Sacramento, Calif.
Though it is not easy, more competitive ISPs are likely to enter more markets, as lower-cost access platforms evolve, helped in some cases by municipal facilities support.
Where that happens, it is conceivable that the incumbents will see a new limitation on their market share, dipping from possibly 50-percent share to a maximum of perhaps 40 percent each, on a long-term basis, assuming the new competitor is not eventually bought out by one of the incumbents.


No comments:
Post a Comment