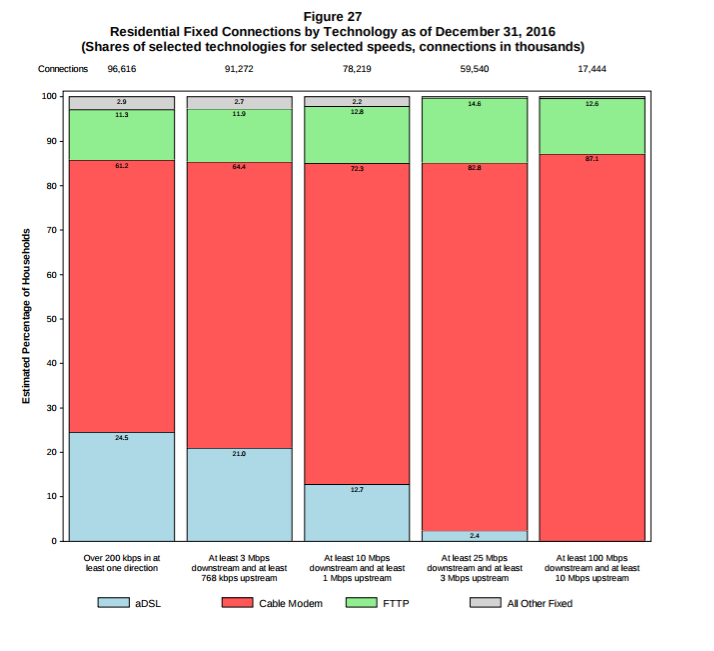
It is hard to overestimate the impact cable TV companies have had in the U.S. internet access business. At every speed tier, cable operators have overwhelming market share, as you immediately can tell from the following graph, where “red” represents cable market share at various speeds. At the higher end, cable has well over 80 percent of sold connections operating at a minimum of 100 Mbps.
But even at the low end, at speeds less than 3 Mbps, cable has 60 percent share.
For better or worse, those adoption statistics reflect deliberate capital investment decisions by U.S. telcos other than Verizon. Basically, many independent telcos have been financially unable to invest faster, while AT&T arguably has made a priority of mobile capital investment.
Verizon “benefits” from having made most of its fiber to premises investments a decade ago.
What comes next is not so clear. Some argue cable operators are in position to leverage their market control to raise prices.
Others might argue that telco fixed wireless is part of the strategy for catching up with cable. And AT&T recently has stepped up investment in gigabit services where it believes their is a business model.
Others might argue that at least AT&T and Verizon are looking past fixed segment competition and hoping to lead in the future mobile and untethered markets. That is part of the interest in both mobile video and fixed wireless built on the mobile network.
Yet others might argue that apps and services beyond internet access will drive revenue in a decade, not access, per se, reducing the value of access investments, in any case.
Still, the market impact cable TV has had is foundational. Its reliance on its own facilities, using different platforms than telcos use, has allowed it to upgrade faster, at lower cost, than telcos have been able to do using fiber to the home.
But most of the share losses have come from telcos other than AT&T and Verizon, which in recent years have been holding their own. In other words, you might argue both those firms have invested enough to get by, while prioritizing investments in mobility that clearly has driven revenue growth for both firms.
The issue now is how much investment has to be tweaked to maintain the “just enough” capex. Many would argue it does not make sense for either AT&T or Verizon to overinvest in fixed network internet access, as the financial return simply will not be there.
At this point, the fixed network internet access market is nearly a zero-sum game. That means most of the market share gains will have to come from other competitors. Such markets are tough.
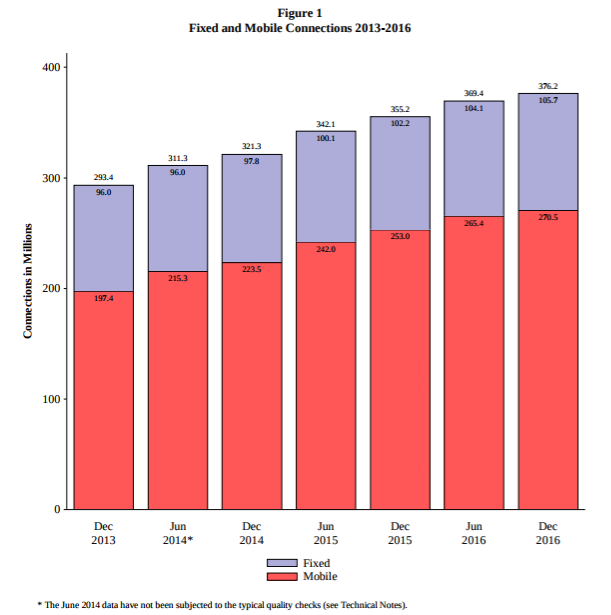
The total number of U.S. internet connections increased by about six percent between December 2015 and December 2016, reaching 376 million, the Federal Communications Commission reports. So there was growth, but at low and slowing rates.
With the caveat that speeds offered by some providers seems to be increasing about 50 percent per year, the 106 million fixed connections at the end of 2016 included 37 percent (39 million connections) operating between 25 Mbps and 100 Mbps, while 23 percent (or 25 million connections) offered speeds of at least 100 Mbps.
That suggests the policy of gradually investment by AT&T, for example, is largely defensive. That makes sense, one might argue, in the context of a business driven by mobility or video services, not internet access.
In the fourth quarter of 2017, for example, AT&T earned 85 percent of revenue from apps, not internet access.
Keep in mind that the FCC figures also represent consumer buying choices, not the services available to buy. Consumers make rational choices about internet access, buying services that provide the best perceived value proposition, not necessarily always the “fastest available” tiers of service.
They buy what is “good enough,” more often than they buy what they deem “best.”
So 62 percent of consumers chose to buy services running faster than 25 Mbps.
Some 38 percent of consumers bought services operating at slower speeds, though it is impossible to say for sure whether those customers were unable to buy faster services, or chose to buy slower services even when faster alternatives were available.
Some four percent of consumers (four million connections) bought services operating slower than 3 Mbps downstream.
Some 14 percent bought (15 million connections) services operating between 3 Mbps and 10 Mbps. Some 22 percent (23 million connections) purchased services running between 10 Mbps and 25 Mbps.
The median (half of connections faster, half slower) downstream speed of all reported fixed connections was 40 Mbps and the median upstream speed was 5 Mbps.
For residential fixed connections, the median downstream speed was 50 Mbps and the median upstream speed was 5 Mbps.
Most of the growth in total Internet connections is attributable to increased mobile Internet access subscribership. The number of mobile Internet connections increased 7% year-over-year to 270 million in December 2016, while the number of fixed connections grew to 106 million – up about 3% from December 2015.


No comments:
Post a Comment